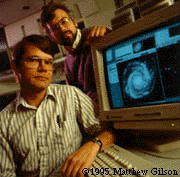
At Fermilab, Rich Kron and Steve Kent are among the Chicago astronomers creating software to automate the galactic census.
 The University of Chicago Magazine April 1995

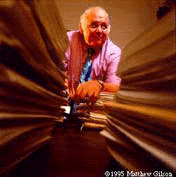
York is project director of the Sloan survey, and his soft-spoken presentation bespeaks an engineer's love of machinery: This component has tolerances of 2.5 microns, that absorption band peaks at 6,280 angstroms. He reels off from memory the specs of a project whose description, in a two-volume proposal to funding agencies, runs some 300 pages.
For York, the hard part of managing the survey--he also helps run Apache Point's recently built 3.5-meter telescope, owned in part by the U of C--isn't technological. "It's all people," he says. "It's very hard to keep people focused, to keep people in a collaboration where you compromise and agree on things together." That task, explains the man who prefers life away from the city and once moved with his family to Apache Point for a year, requires "jawboning." A wry sense of humor helps, too. When he comments that the New Mexico observatory is "like a friendly small town, but full of smart people instead of average people," he doesn't say smart like it's any advantage.
So equipped, he deals with the pressures that build this spring as the astronomers try to keep to their ambitious schedule--a schedule so tight that if one piece of equipment arrives late at Apache Point, the delay buys time for people rushing to meet later deadlines. "Everybody's waiting for the sigh of relief when somebody else slips," says York.
He reviews the status of several critical components, like the primary mirror and the microchips that form the heart of the telescope's digital camera. The curve of the mirror's 2.5-meter glass disk, which gathers incoming starlight, must be perfect: The contractor, York reports, has polished its surface to within a micron--or one-thousandth of a millimeter--of the final shape. Things are going less smoothly with another item. "The most likely problem," he jokes, "is that the managers will break down and shoot each other."
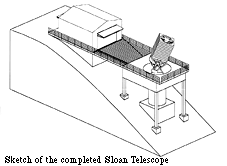
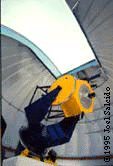
The components all come together in an unusual machine. It will be used exclusively for the Sloan survey--unheard of in astronomy, where researchers describe the competition for telescope time as "vicious." Exclusivity saves time, and means that the Sloan Telescope's design can be tailored to make short work of its Herculean task.
The survey's schedule, though, has a strictly pragmatic origin, and a wholly new design might cause unacceptable delays. Five years, as Chicago astronomy & astrophysics professor Rich Kron explains, is a period "consistent with the attention span of the scientists involved, and of the funding agencies." So the Sloan Telescope relies on scaling up existing technology, starting with the gaping lenses that "see" a piece of sky 36 times the area of the full moon, four times that of other wide-angle telescopes.
Another time-saver: Where older telescopes used photographic plates, this one, like its contemporaries, uses more precise and efficient electronic light sensors called charge-coupled devices, or CCDs. "Essentially like what you have inside of your camcorder," says Kron, CCDs should speed a project like the Sloan survey by drastically shortening exposure times. (They're also what make it the Sloan Digital Sky Survey, since they spit data into a computer numerically, pixel by pixel.)
The survey's wide-angle pictures require a record number of CCDs of near-record-setting size. The largest of these microchips take two months to fabricate and cost $65,000 each; their production last year was mostly touch-and-go. York glumly tells the group at the Fermi Institute that, as of today, they're short ten CCDs. "We're not free of disasters," he cautions.
HEADACHES WITH ELECTRONICS NOTWITHSTANDING, the progress of the survey is light-years from its blue-sky origins in 1989. Once an impractical notion, an enormous charting of galaxies had become practical thanks, in part, to a telescope mirror design by Princeton's James Gunn and Chicago's Ed Kibblewhite that minimized the distortion of wide-angle viewing. The design caught the attention of York and Kron, who invited astronomers from all over the country to discuss the survey idea at an O'Hare airport hotel. Three meetings later, the "O'Hare group" was ready to seek funding.
With surprising luck, says York, grants fell into place. Several of the participating schools, including Chicago, donated $5 million each; the National Science Foundation added an equal sum; and the Alfred P. Sloan Foundation--whose gift named the survey--contributed $8 million. On his office wall, York promptly pinned a photocopy of the first foundation check.
For York, the survey's beginning next year will bring a sigh of relief. For Kron, it represents the start of a new job. As the survey director, Kron will guide the telescope's observing schedule from week to week and month to month. His trips to New Mexico will mean a fourth workplace for the energetic researcher, who already shuttles between offices in Hyde Park, Fermilab, and Yerkes Observatory, where he directs the University's 97-year-old Williams Bay, Wisconsin, facility.
Where will Kron's surveyors survey? Not, he says, anywhere near the plane of Earth's disk-shaped galaxy, which he calls "a nice place to live, but filled with dust." Since the Milky Way obscures objects to its sides, what remains is the space above and below the disk, or the northern and southern galactic caps--given those names because each hemisphere on Earth offers a better view of one cap. The Sloan Telescope, staring into the northern galactic cap, will map out a broad cone of galaxies that fills about a quarter of the celestial sphere and extends two to three billion light-years. In the fall, when the northern cap's constellations move behind the sun, the telescope will chart a skinny but much deeper slice of sky in the southern galactic cap.
Kron, sitting in his Hyde Park office, has turned from his work with graduate student Marianne Takamiya, SM'92. As she continues at the computer a few feet away, Kron explains that the Sloan survey is actually two concurrent surveys. Each uses a different light-sensing instrument, and, for efficiency, the telescope's business end will flip between the two, depending on the weather.
The darkest, clearest hours belong to what Kron calls the telescope's "camera." Considering the instrument's complexity and 400-pound size, this seems akin to calling the Berlin Philharmonic a "band." While an array of CCDs generates five-color pictures, he explains, the camera's other CCDs will establish positions relative to well-known bright stars.
This "imaging" survey won't operate like conventional telescopes that track an object's motion across the sky (a motion caused, of course, by the Earth's own rotation). Instead, "drift scanning" allows the objects to slip past parallel to the rows of CCDs, creating pictures in long strips and saving the time usually spent repositioning the telescope again and again. "You can't find another observatory doing that," comments Kron.
The imaging survey's electronic eyes will capture a stunning inventory of 50 million galaxies, 70 million stars (located in our own galaxy), and up to 1 million quasars, or quasi-stellar objects. But it would make a dull map, since pictures alone can't determine an object's distance from Earth or its location in three dimensions.
Enter the second survey. On brighter or cloudy nights, the camera is replaced with spectrographs that record the color or wavelength of an object's light. In fact, through a spaghetti-bowl of glass fibers, the telescope will digitally record light from 600 objects at once. Because more distant galaxies and quasars are receding from Earth faster than those nearby (the 1929 discovery of Edwin Hubble, AB'10, PhD'17), and because their motion reddens the color of their light, measuring the degree of "red shift" reveals a galaxy's distance from Earth.
In his office, Kron and Takamiya gladly point out a computer screen that displays one galaxy's light spectrum. What represents a galaxy flashing away at mind-bending speeds looks to their unschooled visitor like thin, black lines plodding across the screen. Kron's feelings aren't hurt. "To us," he says, "this is a thing of great beauty."
He should know. A veteran of deep red-shift surveys, Kron has studied some of the farthest observable galaxies from Earth. But ironically, he says, our "local universe"--the only part that can be seen with much completeness--isn't well mapped. The Sloan survey will explore just this region, taking red-shift soundings on the brightest one million of the original 50 million galaxies--and on 100,000 quasars.
"Quasars," he explains, "are a special breed of galaxy that have something monstrous happening in their center. We imagine that it's a large black hole." Found at the far edges of the universe, the mysterious quasars will show the universe's structure when it was only 20 percent of its present age. No similar survey, Kron adds, can chart them, since other telescopes lack the five-color CCDs needed to tell quasars from stars. "What you get," he says, "is a map with a million galaxies within a cone like this"--he swings out an arm's-length circle in the air--"and then the quasars are way out here." He jumps up to sprinkle a few at the other end of his office.
It's one thing for Kron to shuffle a few imaginary galaxies, and another to work with real data. The survey scientists--short of discovering a whole planet of grad students--couldn't possibly separate 50 million galaxies from 70 million stars and classify each galaxy by shape and brightness.
The solution is the survey's biggest technological contribution to astronomy: computer automation of the digital data analysis. The challenge offered by the survey attracted experts at Fermilab, where particle-physics experiments also require specialized computer hardware and databases of enormous scale. The project's plan sounds like a flood-control campaign, with four "pipeline coordinators" leading groups of astronomers and programmers to write software for each "pipeline" of data streaming from the New Mexico mountain. At Fermilab, Kron leads a team from the lab and the University that's handling the deluge of red-shift calculations.
One hopes the levees will hold. Each night of observing, the survey will generate up to 90 gigabytes of data--some of which must be analyzed immediately to pick galaxies for the red-shift survey--data that will send to Fermilab by overnight mail.
THE ENTIRE SURVEY, scheduled to be done by 2001, will be published two years later in at least three formats: a low-resolution map of the entire area, an atlas of individual objects with their locations and images, and the spectra of selected galaxies and quasars. For armchair travelers, Don York mentions the possibility of presenting the red-shift data in a virtual-reality map. Viewers, he says, "could move around in the three-dimensional lattice, and go from galaxy to galaxy."
"There is something striking and romantic," says Bob Rosner, chair of astronomy & astrophysics, about looking at the largest objects that exist. "And the obvious questions are, what do they look like? and why in the world are they there?"
His questions also state the main scientific impetus behind the Sloan survey: to study large-scale structures as geographic features, like caves or coastlines, and to learn what these features reveal of the universe's history. The survey will aid other projects--Rosner, for example, may use the star atlas to trace how our galaxy has changed shape over time--but the big picture is about large forms for which galaxies are merely beacons.
Rich Kron describes this speculative landscape: "You have clusters of galaxies, and they cluster into larger things called superclusters. The negative of that also holds--just as the clusters are connected by superclusters, the voids are connected by tunnels. There's a matrix like a sponge: holes connected by tunnels, and clusters connected by filaments. Then, when the voids get big enough, they push the matter out into sheets"--like the filmy surfaces of soap bubbles.
But that description could be deceptive. Take the "existence" of voids or bubbles, says York. "That means somebody did a modest survey, looked at the picture and said, `Oh, there's a bubble.' It doesn't mean they exist everywhere, that they're dominant structures in the universe." This, he argues, is where the survey comes in. "We want a thousand or three thousand of these things. Do they have a characteristic shape? Do they all contain the same amount of spiral galaxies?"
There is also the question of origin. How did such structures--or any structures, for that matter, from superclusters down to planets--evolve from the smooth particle soup that followed the big bang? The leading explanation, says York, is a two-part recipe. "You have to have an enormous amount of mass--the so-called missing mass--to make gravity effective, and then have the seeds of fluctuations coming out of the big bang," seeds that represent "some slight difference in the distribution of objects."
In 1992, strong evidence for these "seeds" of structure came from a NASA satellite called COBE, for Cosmic Background Explorer. Its headline-making discovery: tiny temperature variations caused by ancient irregularities in mass distribution. COBE's map of temperature levels may even match actual large-scale structures charted by the Sloan survey.
As for a structured universe's other ingredient, telescopes can't see the "missing mass"--hence its alias, dark matter. But they can witness its effects: Through gravity, the presence of dark matter theoretically drives the clustering of galaxies, just as its total amount determines whether the universe as a whole will expand forever or begin to contract.
Paired with other surveys, the Sloan Digital Sky Survey could document this evolution of clusters--which York calls "a real Rosetta stone"--and confirm the role of dark matter. To do so would link observation and theory across the grandest scales, and link a mountaintop in New Mexico with the fate of everything.

At Fermilab, Rich Kron and Steve Kent are among the Chicago astronomers creating software to automate the galactic census.
 Click here for larger image

