Lite of the mind (a light-hearted look at all things Chicago)
That's sΘ Maroon
By Benjamin Recchie, AB’03
Graphics by Allen Carroll; photography by Newscom
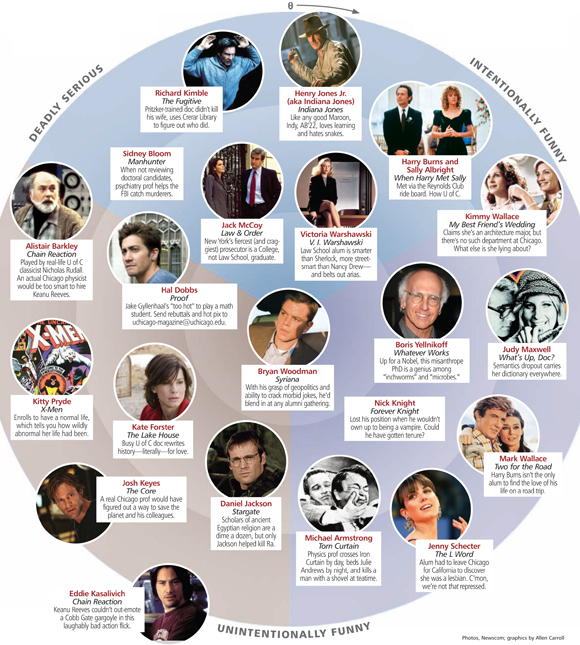
To demonstrate how well University of Chicago TV and movie characters mimic the real deal, we've plotted a sample of fakes on (what else?) a polar-coordinate chart.
Still with us? Each point is described by an ordered pair (r, Θ), where r is the radius from the center and Θ is the angle from the vertical axis. The higher r's value (i.e., closer to the edge), the less believable the Maroon. High Θ values denote deadly serious characters. Low Θ indicates a character who's intentionally funny; intermediate Θ denotes one unintentionally so. Check the polar-coordinate chart, and let us know which Maroons are missing and where they would land.
Find the chart below too small to read? View the hi-res pdf.